IR BLOG
How to read Sampo’s result reports
In general, P&C insurance business is quite easy to understand. The customer buys an insurance policy, gets financial protection against losses from certain events and, if the insurance company has managed to assess and price the risks correctly, it makes a profit. However, insurance companies’ result reports may sometimes be a bit difficult to comprehend, given that the industry specific terminology is often quite technical, and the P&L lines are different than for example industrial companies have. Therefore, in this blog post we go through the main P&L items and key figures disclosed in Sampo’s result reports.
Let’s start the journey by looking at If’s results table, which can be found in the Business areas section in our quarterly reports (page 11 on January-June 2023 report). Please note that this is a summary of the main P&L items. The full comprehensive P&L as well as balance sheet and other notes can be found in the tables section at the back of the report.
| RESULTS, EURm | 1-6/2023 | 1-6/2022 | Change, % | 4-6/2023 | 4-6/2022 | Change, % |
|---|---|---|---|---|---|---|
| Gross written premiums | 3,273 | 3,267 | 0 | 1,307 | 1,343 | -3 |
| Insurance revenue, net | 2,466 | 2,481 | -1 | 1,231 | 1,259 | -2 |
| Claims incurred, net | -1,520 | -1,524 | 0 | -761 | -749 | 2 |
| Operating expenses and claims handling costs | -519 | -513 | 1 | -260 | -263 | -1 |
| Insurance service result / underwriting result | 427 | 444 | -4 | 210 | 248 | -15 |
| Net investment income | 339 | 150 | 126 | 100 | 92 | 8 |
| Insurance finance income or expense, net | -101 | 626 | - | 13 | 383 | -97 |
| Net financial result | 238 | 776 | -69 | 112 | 475 | -76 |
| Other items | -8 | 7 | - | -2 | 9 | - |
| Profit before taxes | 657 | 1,227 | -46 | 320 | 732 | -56 |
| KEY FIGURES, EURm | 1-6/2023 | 1-6/2022 | Change | 4-6/2023 | 4-6/2022 | Change |
| Combined ratio, % | 82.7 | 82.1 | 0.6 | 82.9 | 80.3 | 2.6 |
| Cost ratio, % | 21.0 | 20.7 | 0.4 | 21.1 | 20.9 | 0.3 |
| Risk ratio, % | 61.6 | 61.4 | 0.2 | 61.8 | 59.5 | 2.3 |
| Large claims and severe weather, % | 2.8 | 0.0 | 2.8 | 7.1 | -1.7 | 8.8 |
| Risk adjustment and other technical effects, current year % | 1.3 | 1.2 | 0.0 | 1.0 | 0.8 | 0.1 |
| Prior year development, % | -4.1 | -2.4 | -1.7 | -6.0 | 0.0 | -6.0 |
| Adjusted risk ratio, current year, % | 61.7 | 62.6 | -1.0 | 59.6 | 60.3 | -0.7 |
| Discounting effect, current year, % | -3.2 | -2.6 | -0.6 | -3.4 | -3.2 | -0.2 |
| Loss ratio, % | 67.3 | 66.8 | 0.4 | 67.4 | 64.9 | 2.5 |
| Expense ratio, % | 15.4 | 15.3 | 0.1 | 15.5 | 15.4 | 0.1 |
Gross written premiums
Gross written premiums can be considered as the key top line figure to pay attention to. It is the sum of all premiums for insurance policies that have become effective during the reporting period, regardless of whether they have been invoiced or paid.
For example, if a customer buys a home insurance policy on 1 January and the premium is EUR 100 for the full year, an insurance company will book the whole EUR 100 for the first quarter as gross written premiums.
Insurance revenue
When the insurance company has fulfilled its obligation to cover the risk and provide financial protection for its customers over the predefined period, written premiums turn to earned premiums i.e. insurance revenue.
In the example above, 1/4 of that EUR 100 premium, i.e. EUR 25 would have been earned as insurance revenue in the first quarter as the insurance company has fulfilled its obligation for the first 3 months.
In Sampo’s result summaries, insurance revenue and claims incurred as well as all the key ratios are presented net of reinsurance.
Claims incurred
Claims incurred for the reporting period include claims payments during the period and changes in the liability for incurred claims, i.e. the reserves an insurance company has held back to pay out the future claims.
In the old IFRS 4 accounting standard, changes in discount rates affected the claims figure but in IFRS 17, which became effective in 2023, this effect was moved to net financial result.
Operating expenses
Operating expenses consist of all the other everyday expenses, such as rent and staff costs, except claims. In If’s table, claims handling costs are considered as part of operating expenses, but at the Group level and for Hastings and Topdanmark, claims handling costs are part of claims. More about this difference in the ratio section below.
Insurance service result / underwriting result
Insurance service result is the insurance revenue less claims and operating expenses. For If and Topdanmark, this is the same as underwriting profit. However, Hastings has some items in underwriting result that are not included in the insurance service result.
Tip: insurance service result can simply be calculated by using the calculation formula insurance revenue x (100% - combined ratio, %).
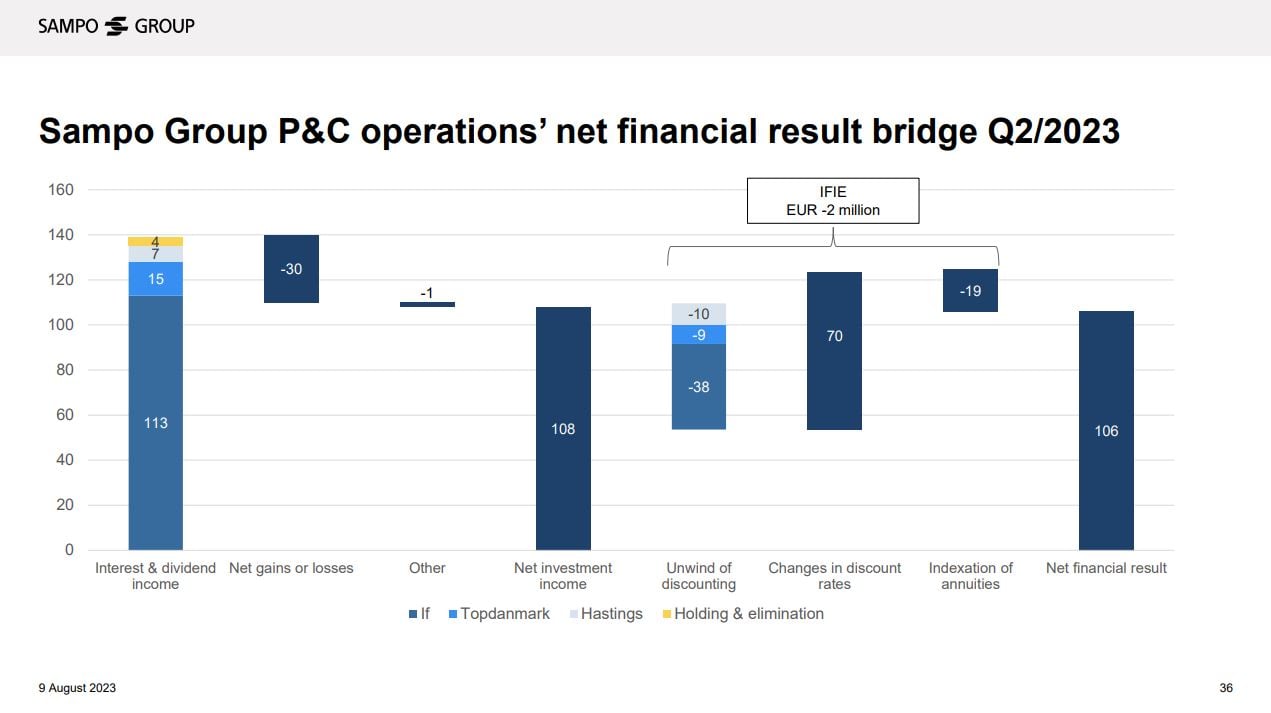
Net financial result
The underwriting result is the main profit component in Sampo’s P&L, but the other major item is net financial result.
The two main components of net financial result are net investment income and insurance finance income or expense (IFIE).
Net investment income consists of the returns on investments that cover liabilities. Interest and dividend income provide stable returns, but short-term market volatility may occasionally have big impacts, positive or negative, on net investment income. In the IFRS 9 accounting standard, that Sampo adopted in the beginning of 2023, changes in market values are booked mark-to-market in the P&L, whereas under the old standard, only realised gains and losses went through the P&L. This means that 2023 figures are not fully comparable with 2022 figures.
The second component, IFIE, consists of a couple of sub-components related to the liability side, with changes in discount rates being the most prone to market fluctuations. The effect can be positive or negative depending on which direction interest rates move. Increase in discount rates has a positive effect and vice versa.
IFIE also includes an ongoing unwind of discounting, which reflects the loss of discounting benefit as time goes by and liability for incurred claims approach the payment date. This effect, as well as the indexation of annuities, which is more of a technical item, should be quite stable over time.
Key ratios
Combined ratio
Combined ratio is probably the most used key figure for a P&C insurer as it shows how well the company has succeeded in underwriting and being efficient. The calculation formula is (claims incurred + operating expenses) / insurance revenue. The lower the combined ratio, the better.
In Q2/2023, If’s combined ratio was 82.9 per cent. This means that for every EUR 100 as an insurance revenue, EUR 82.90 was consumed by claims and operating expenses. The residual, EUR 17.10 forms the insurance service result.
Expense ratio and loss ratio
As the name combined ratio implies, it is a combination of something. More specifically, it is the sum of expense ratio and loss ratio. These ratios are disclosed at the Group level as well as for each subsidiary.
The calculation formula for expense ratio is operating expenses / insurance revenue. For loss ratio, it is claims incurred / insurance revenue.
Cost ratio and risk ratio
In addition to the expense ratio and loss ratio, for If, we also disclose cost ratio and risk ratio as one of our financial targets is to reduce If’s cost ratio annually.
The difference comes from the allocation of claims handling costs. In expense ratio / loss ratio, the claims handling costs are included in claims, whereas in cost ratio / risk ratio, those are part of operating expense.
Adjusted risk ratio
Severe weather events, natural catastrophes and large claims are part of normal everyday business for Sampo, but these do not occur evenly over each quarter. For example, Q2/2023 was affected by a rockslide in Norway as well as few property-related large claims, whereas in Q1/2023, large claims were below the budget.
As investors and analysts pay attention to the underlying performance, we disclose an adjusted risk ratio for If. This excludes the volatile claim items as well as some technical items. These items are disclosed in the table as percentage of insurance revenue. More about these adjustments below.
Large claims and severe weather
Large claims are usually property-related damages such as a factory fire. These are measured against a budget, meaning we expect some large claims every quarter. Severe weather claims, which also include natural catastrophes, on the other hand, are reported in full. In If’s key figures table, a negative figure indicates a positive outcome and vice versa. For example, large claims and severe weather had negative effect of 7.1 percentage points in If’s risk ratio in Q2/2023.
Risk adjustment and other technical effects
Items on this line are more or less technical and mainly related to IFRS 17 accounting. Risk adjustment reflects the uncertainty with the amount and timing of cash flows arising from non-financial risks, such as longevity risk and inflation risk. The management applies judgement regarding the determination of this.
Prior year development (PYD)
Prior year development, also known as run-off, is a profit or loss that arises when claims originating from prior years are either finally settled or revaluated. For example, if an insurance company has originally reserved EUR 100 for a claim but later it turns out that the cost was only EUR 98, a run-off gain of EUR 2 emerges.
Discounting effect
Under IFRS 17, all claims are discounted, including current year claims. This has a positive effect in the current year combined ratio, and it increases or decreases as discount rates increase or decrease. The discounting effect is included in the adjusted risk ratio, but we just disclose the effect for clarity.
Hastings-related key figures
Hastings’ operating model and revenue streams differ somewhat from If and Topdanmark and that is why the result tables for Hastings (page 15 on January-June 2023 report) have some differences as well.
| RESULTS, EURm | 1-6/2023 | 1-6/2022 | Change, % | 4-6/2023 | 4-6/2022 | Change, % |
|---|---|---|---|---|---|---|
| Gross written premiums | 798 | 605 | 32 | 435 | 331 | 32 |
| Other income from insurance contracts | 113 | 107 | 6 | 60 | 53 | 14 |
| Insurance revenue, net | 518 | 406 | 28 | 272 | 222 | 22 |
| Claims incurred and claims handling costs, net | -330 | -218 | 52 | -168 | -117 | 44 |
| Operating expenses | -124 | -110 | 12 | -65 | -55 | 18 |
| Insurance service result | 64 | 78 | -18 | 39 | 51 | -23 |
| Other P&C insurance related income or expense | -10 | -19 | -46 | -4 | -10 | -59 |
| Underwriting result | 54 | 59 | -9 | 35 | 41 | -14 |
| Net investment income | -2 | 4 | - | -16 | 1 | - |
| Insurance finance income or expense, net | -4 | 15 | - | 3 | -1 | - |
| Net financial result | -6 | 19 | - | -12 | - | - |
| Other items | -21 | -32 | -35 | -6 | -16 | -65 |
| Profit before taxes | 27 | 46 | -42 | 17 | 25 | -31 |
| KEY FIGURES, EURm | 1-6/2022 | 1-6/2022 | Change | 4-6/2023 | 4-6/2022 | Change |
| Operating ratio, % | 90.8 | 87.1 | 3.7 | 88.6 | 83.7 | 5 |
| Loss ratio, % | 63.8 | 53.6 | 10.1 | 61.6 | 52.5 | 9 |
| Total revenue, EURm* | 584 | 461 | 27 | 309 | 250 | 23 |
| Live customer policies (millions) | 3.4 | 3.2 | 0.2 |
The first difference is that in addition to gross written premiums, there is a line Other income from insurance contracts. This consists of internal broker revenue, which is not recognised as premiums but comes from insurance contracts and therefore is included in the insurance revenue. To add complexity, there is also a line Other P&C insurance related income or expense, which for example includes external broker revenue. This is not included in the insurance service result, but is part of the underwriting result, for which we have a Group-level target.
Due to these differences, the calculation formula for Hastings’ main underwriting profitability indicator, Operating ratio, differs from the combined ratio calculation formula for If and Topdanmark. Instead of insurance revenue, the denominator in this calculation is Total revenue, which is the sum of insurance revenue and broker revenues. Thus, the calculation formula for Hastings’ operation ratio is 1 – (underwriting profit / total revenue).
Solvency and financial leverage
In addition to the main P&L key figures, investors and analysts pay attention to solvency and financial leverage since those are important when estimating Sampo’s ability to pay dividend and distribute excess capital.
Solvency II ratio
The main objective of the Solvency II framework is to ensure that insurance companies operating within the EU have sufficient capital to cover their risks. In other words, to ensure the adequate protection of policyholders in highly adverse scenarios.
The calculation formula for the Solvency II ratio is own funds / Solvency capital requirement (SCR).
Own funds represent insurance company’s net assets. In addition, hybrid debt is eligible for own funds in Solvency II calculation. There is a number of technical factors that affect the own funds development but to simplify; when an insurance company makes profit, own funds increase and when an insurance company pays dividend or buys back own shares, own funds decrease.
Solvency capital requirement (SCR) is the minimum amount of own funds i.e. the capital an insurance company has to hold to make sure that its policyholders are protected, and claims can be paid even in the worst possible scenario. To be more specific, the level of the SCR is meant to ensure that the likelihood of an insurer being unable to pay claims during any one year is no more than 1:200, i.e. 0.5 per cent.
The total SCR consists of various risk factors (see picture below), of which the market risk is the most volatile one as it is affected by the movements in the equity and fixed income markets. In line with the strategy and capital management framework announced at the 2021 CMD, Sampo has been reducing its market risk and exiting Nordea played a key role in this. At the end of 2020, the Group’s market risk amounted to EUR 5.1 billion. Now it is less than EUR 2.9 million and the planned demerger and separation of Mandatum will reduce it further.
In June 2023, Sampo submitted an application for a Group Partial Internal Model (PIM), which would decrease the insurance risk and hence, the total SCR. More information about PIM can be found at the blog entry published in June 2023.
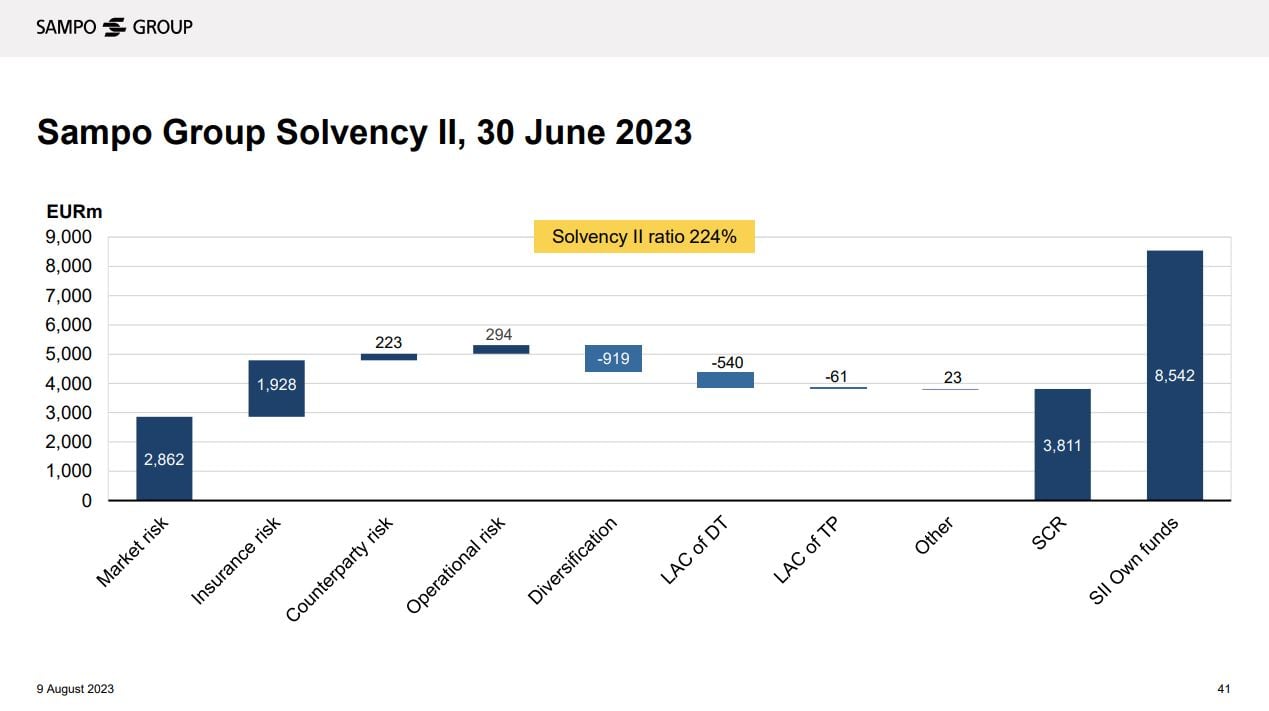
At the end of June 2023, Sampo Group’s own funds amounted EUR 8,542 million and SCR to EUR 3,811 million. Thus, the Solvency II ratio was 224 per cent. We also disclose an adjusted figure, which includes the dividend accrual based on the latest regular dividend of EUR 1.80 per share. This means that 1/4 of the annual regular dividend is deducted from the own funds at the end of first quarter, 2/4 at the end of second quarter and so forth. Including dividend accrual, the Solvency II ratio was 212 per cent, well above the target of 170-190 per cent for 2021-2023. Share buyback programmes, on the other hand, are always deducted in full when they are announced, regardless of the actual timing of the purchase period.
Financial leverage
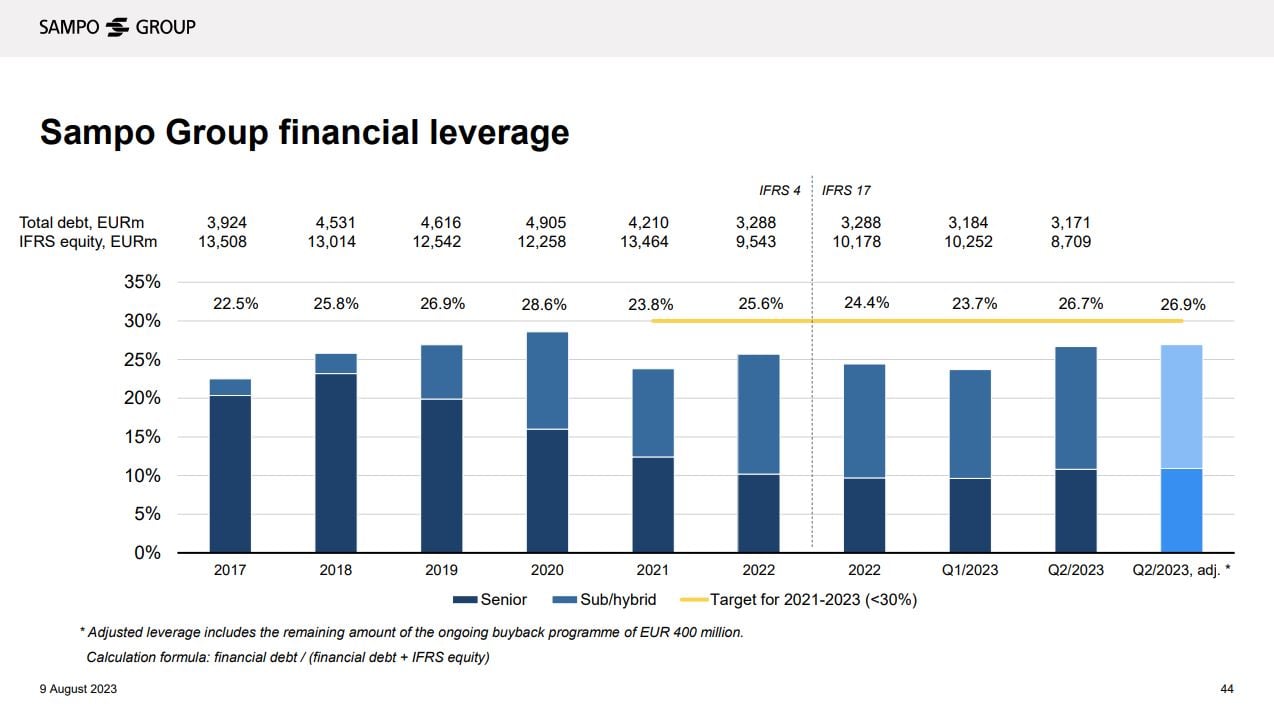
This figure tells how leveraged Sampo’s balance sheet is. The calculation formula is financial debt / (financial debt + IFRS equity).
Making profit increases the IFRS equity and hence, decreases the financial leverage. Respectively, paying dividend or buying back shares will decrease the IFRS equity and increase the financial leverage.
At the end of June 2023, Sampo Group’s total financial debt was EUR 3,171, consisting of both senior and hybrid bonds, and IFRS equity amounted to EUR 8,709 million. Thus, the financial leverage was 26.7 per cent. The target for 2021-2023 is a financial leverage of below 30 per cent.
As shown in the picture below, the IFRS equity has decreased quite sharply during the past years. This has been driven by distributions of excess capital via buybacks and extra dividends. At the same time, we have been reducing our senior debt to keep the financial leverage within the target. Why senior debt and not hybrid debt? Because hybrid debt is eligible for own funds in Solvency II calculation as mentioned above.
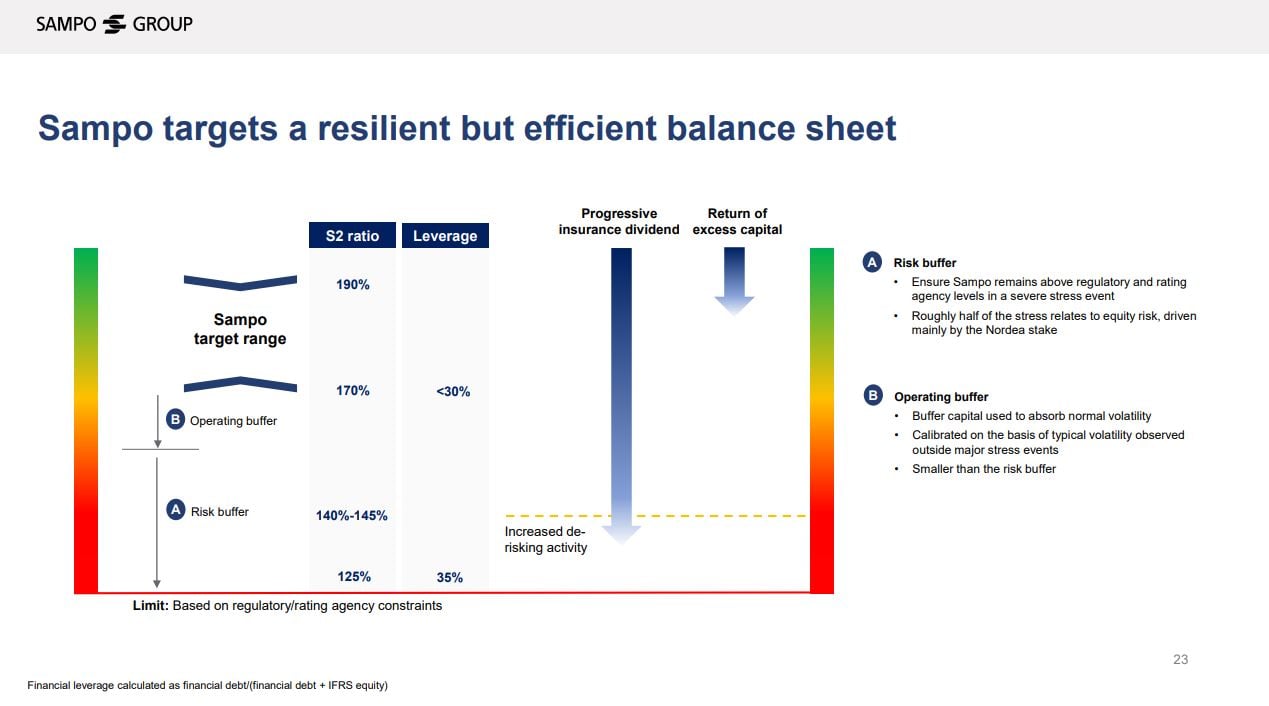
Sampo’s solvency and financial leverage targets
Naturally, an insurance company cannot operate with a Solvency II ratio of just above minimum requirement of 100 per cent, because both the own funds and the SCR are prone to short-term volatility. At Sampo, we have set an absolute minimum limit to 125 per cent for the Group, reflecting regulatory constraints.
When setting our solvency target, we added a risk buffer on top of the 125 per cent limit and an additional operating buffer on top of that to ensure that the Group can comfortably operate and pay dividend even in an adverse market environment. This approach is illustrated in the picture below, which is from the 2021 CMD presentation. Please note that at the time, Sampo still held around 16 per cent of Nordea, which needed to be taken into account when setting the buffers and targets. As we have communicated, now that the market risk has been reduced and will be reduced further with the planned demerger, Sampo could be able to operate with lower financial buffers.
What comes to the financial leverage target, the limit reflects rating agencies’ views on what should be considered as the maximum leverage for the credit ratings we wish to maintain. However, financial leverage is not the only factor rating agencies pay attention to.
I hope this blog provided some clarification for those not so familiar with insurance terminology yet. For more information and detailed definitions on different P&L items, please take a look at the table sections in our result reports and accounting principles disclosed in our annual reports.
Pictures: Q2/2023 Investor presentationinternal link and 2021 Capital Markets Day presentationinternal link
