IR BLOG
January-June 2023 results - Q&A
Sampo Group's P&C operations performed well in the first half of 2023 as operational momentum remained strong, but currency headwinds and large and natural catastrophe claims weighed on reported figures.
Profit before taxes amounted to EUR 722 million in the first half of 2023, representing an increase of 32 per cent after adjusting for IFRS 9 (546). Earnings per share amounted to EUR 1.13 (3.08), of which EUR 0.99 was from continuing operations.
In Q2, profit before taxes increased to EUR 363 million after adjusting for IFRS 9 (269). Earnings per share amounted to EUR 0.60 (1.66), of which EUR 0.52 was from continuing operations.
The Group underwriting profit grew by 3 per cent on a currency adjusted basis. On a reported basis, underwriting profit declined by 2 per cent to EUR 598 million (611). The Group combined ratio weakened to 83.8 per cent (82.9).
In Q2, the Group underwriting profit amounted to EUR 306 million (369) and the Group combined ratio was 83.5 (79.7).
| Key figures, EURm | 1-6/ 2023 |
1-6/ 2022 |
Change, % |
4-6/ 2023 |
4-6/ 2022 |
Change, % |
|---|---|---|---|---|---|---|
| Profit before taxes (P&C Operations) | 722 | 1,515 | -52 | 363 | 824 | -56 |
| If | 657 | 1,227 | -46 | 320 | 732 | -56 |
| Topdanmark | 105 | 43 | 142 | 42 | 28 | 47 |
| Hastings | 27 | 46 | -42 | 17 | 25 | -31 |
| Holding | -60 | 203 | - | -15 | 40 | - |
| Net profit for the equity holders | 575 | 1,658 | -65 | 304 | 886 | -66 |
| Underwriting result | 598 | 611 | -2 | 306 | 369 | -17 |
| Change | Change | |||||
| Earnings per share (EUR) | 1.13 | 3.08 | -1.95 | 0.60 | 1.66 | -1.06 |
| Operational result per share (EUR) | 1.07 | - | - | 0.56 | - | - |
| Return on equity, % | 10.1 | 6.5 | 3.6 | - | - | - |
| Profit before taxes (adjusted for IFRS 9), EURm *) | 722 | 546 | 32% | 363 | 269 | 35% |
The comparison figures for 2022 have been restated for IFRS 17 but not for IFRS 9, meaning some figures, such as investment
income, are not presented on a comparable basis between the reporting periods. Net profit for the equity holders, EPS and return
on equity figures include results from life operations. Mandatum was classified as discontinued operations as of 31 March 2023.
*) To enhance comparability, a Group profit before taxes (P&C operations) figure adjusted for IFRS 9, reflecting market value
movements, has been provided for the prior year.
The figures in this report have not been audited.
The Group top line growth was 11 per cent on a currency adjusted basis in Q2. What were the key growth drivers?
In the Nordics, all business areas saw solid growth, driven by rate actions and continued high retention. One of the highlights this quarter was the currency adjusted growth in If’s largest business area Private accelerating to 5.1 per cent year-on-year from 3.5 per cent in Q1. The growth was driven by non-motor lines, particularly personal insurance which saw 11 per cent growth.
Nonetheless, the highest top line growth came from the UK, where the pricing momentum in motor insurance continued to improve over the quarter. Hastings reported a currency adjusted top line growth of 33 per cent, supported by the improving pricing dynamics but also by growing customer base in both motor and home insurance.
On a reported basis, Group top line growth was 4 per cent in Q2 due to the weakening of the Swedish and Norwegian krona. At the end of June 2023, both currencies had weakened over 10 per cent against the euro year-on-year.
The Group underwriting result decreased by 17 per cent in Q2. What explained this development?
In Q2, the Group underwriting margins were negatively affected by unfavorable claims dynamics both in the Nordics and in the UK.
In the Nordics, underwriting margins were affected by a marked-wide claim related to a rockslide in Norway as well as a number of other property-related large claims, mainly in Industrial. In total, large claims and severe weather (including natural catastrophes), had a negative effect of 7.1 per cent (-1.7) on If’s second quarter risk ratio. However, If’s underlying performance remained on a positive trend as the adjusted risk ratio excluding discounting effect improved by 0.5 percentage points year-on-year.
In the UK, the claims inflation remained elevated, which combined with a modest rise in claims frequency, weighed on margins.
In addition to the unfavorable claims experience, the Group underwriting result was affected by the currency headwind mentioned above. On a currency adjusted basis, the Group underwriting profit decreased by 12 per cent in Q2.
How did the claims inflation develop in Sampo’s core markets?
In the Nordics, claims inflation remained stable at 4-5 per cent for the third consecutive quarter, with the components shifting from material and energy to wages. We have continued to cover this with price increases while maintaining high retention. In the UK, claims inflation continued to be elevated but broadly unchanged at around 12 per cent.
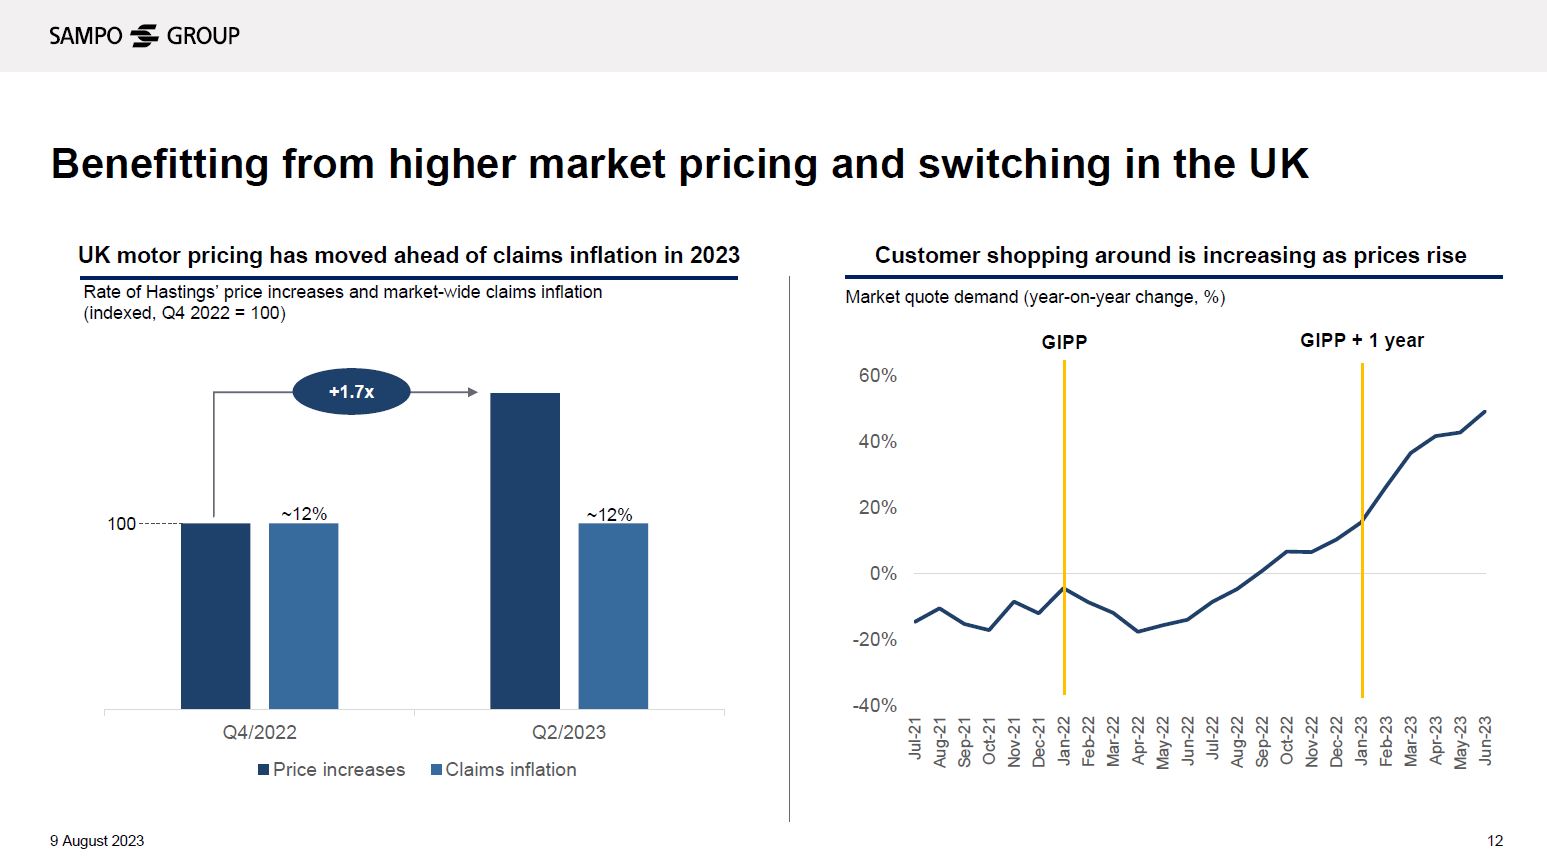
How did the pricing environment in the UK motor insurance develop?
The pricing trends in the UK motor insurance hardened significantly over the quarter in response to high claims inflation and a rise in claims frequencies.
As illustrated in the left-hand side chart below, the rate of Hastings’ price increases has significantly accelerated from Q4/2022, while the claims inflation has remained broadly unchanged. The right-hand side chart shows that the market quote demand for motor insurance has been increasing as customers are shopping around.
The improving pricing environment has allowed Hastings to gain new customers while increasing prices. However, it’s important to note that it takes some time for the price increases on written business to go through the P&L as earned premiums. Due to this lag, the ongoing claims trend had a negative effect on Hastings’ underwriting margins.
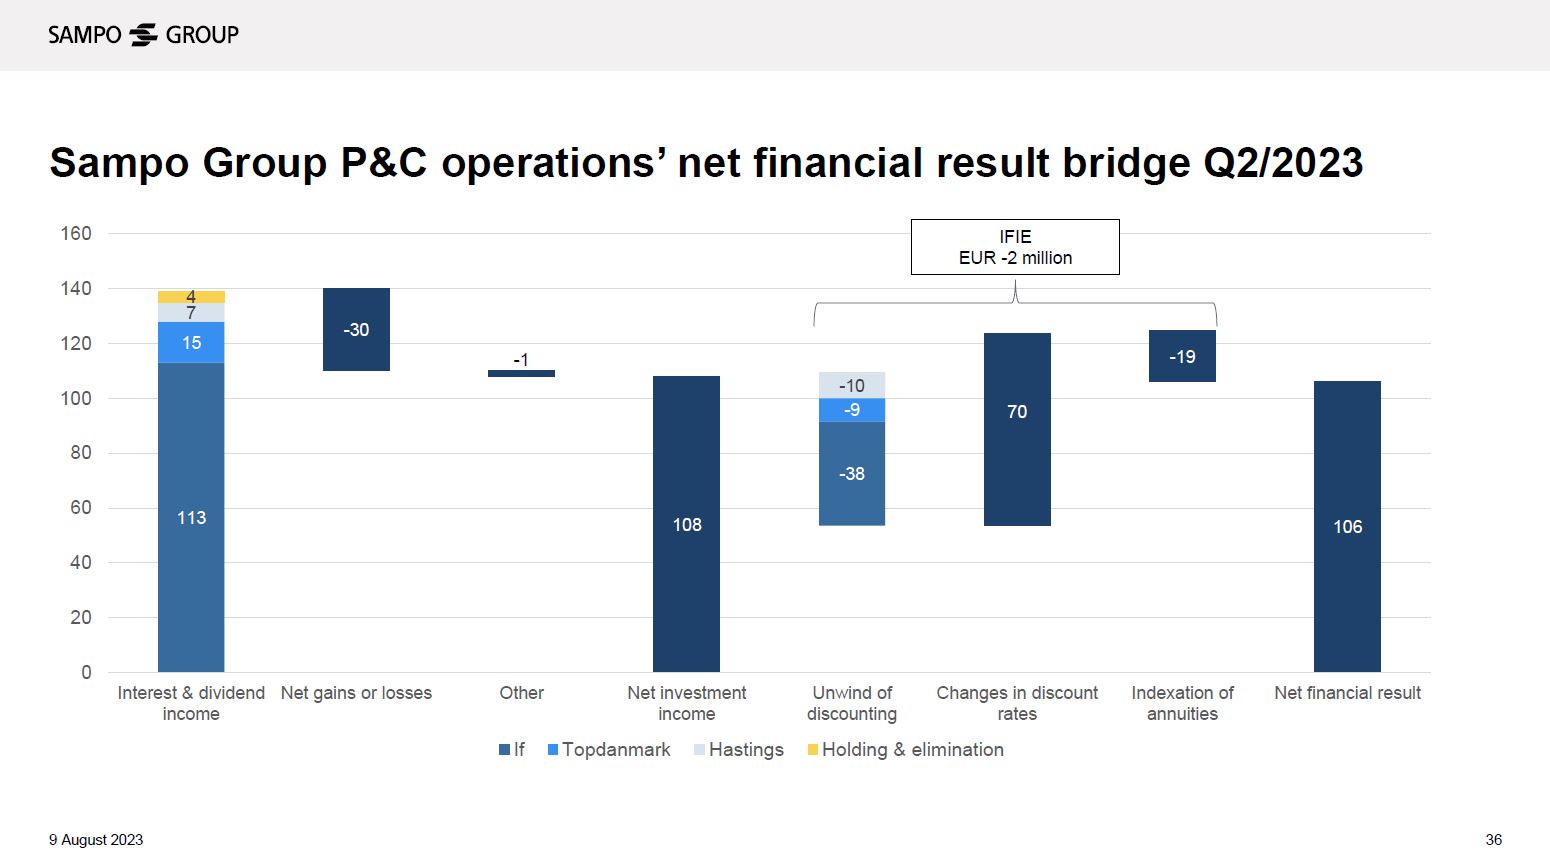
Underwriting result is the main profit component in Sampo’s P&L, but the other one is net financial result. What does this consist of?
The two main components of net financial result are net investment income and insurance finance income or expense (IFIE).
Let’s begin with the net financial result. As the name implies, this consists of the returns on investments that cover liabilities. As shown in the chart below, the net investment income for Q2 amounted to EUR 108 million. This was driven by solid interest and dividend income. The net losses of EUR -30 million were driven by adverse market value movements in fixed income offsetting the good performance on equities.
The second component, IFIE, consists of a couple of sub-components related to the liability side, with changes in discount rates being the most prone to market fluctuations. In Q2, this had a positive effect of EUR 70 million due to increase in discount rates, whereas in Q1 it had a negative effect of EUR -61 million due to fall in discount rates. The effects of unwind of discounting and indexation of annuities, on the other hand, should be quite stable over time.
How is the demerger process and listing of Mandatum going? (Updated 12 September 2023)
The demerger process has continued as planned and we are on track to list Mandatum on Nasdaq Helsinki on 2 October 2023.
The last day to buy Sampo shares for a shareholder to be entitled to receive Mandatum shares as a demerger consideration is 29 September 2023 (previously, this was incorrectly announced to be 27 September 2023).
The first trading day for Sampo share without Mandatum is 2 October 2023, which is also estimated to be the first trading day for Mandatum.
Pictures: Q2/2023 Investor presentation
