IR BLOG
January-September 2022 results - Q&A
Sampo Group reported solid results in the third quarter of 2022, driven by continued robust underwriting performance.
The Group’s profit before taxes amounted to EUR 1,472 million (1,974) in January-September and EUR 407 million (632) in the third quarter. Excluding all Nordea-related items, profit before taxes was EUR 1,212 million (1,356) in January-September and EUR 407 million (374) in the third quarter.
Earnings per share was EUR 2.19 (2.74) in January-September and EUR 0.58 (0.93) in the third quarter.
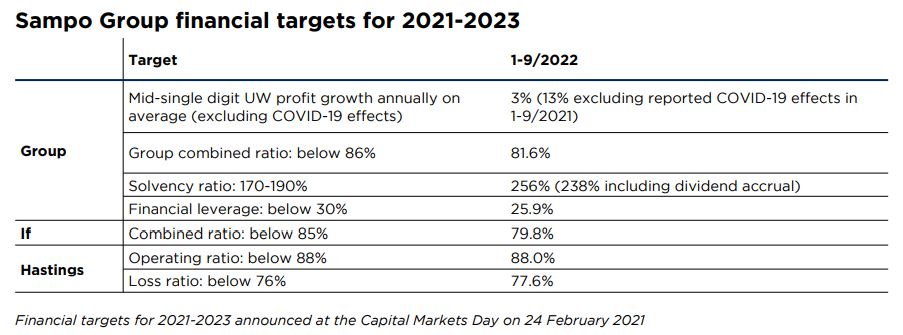
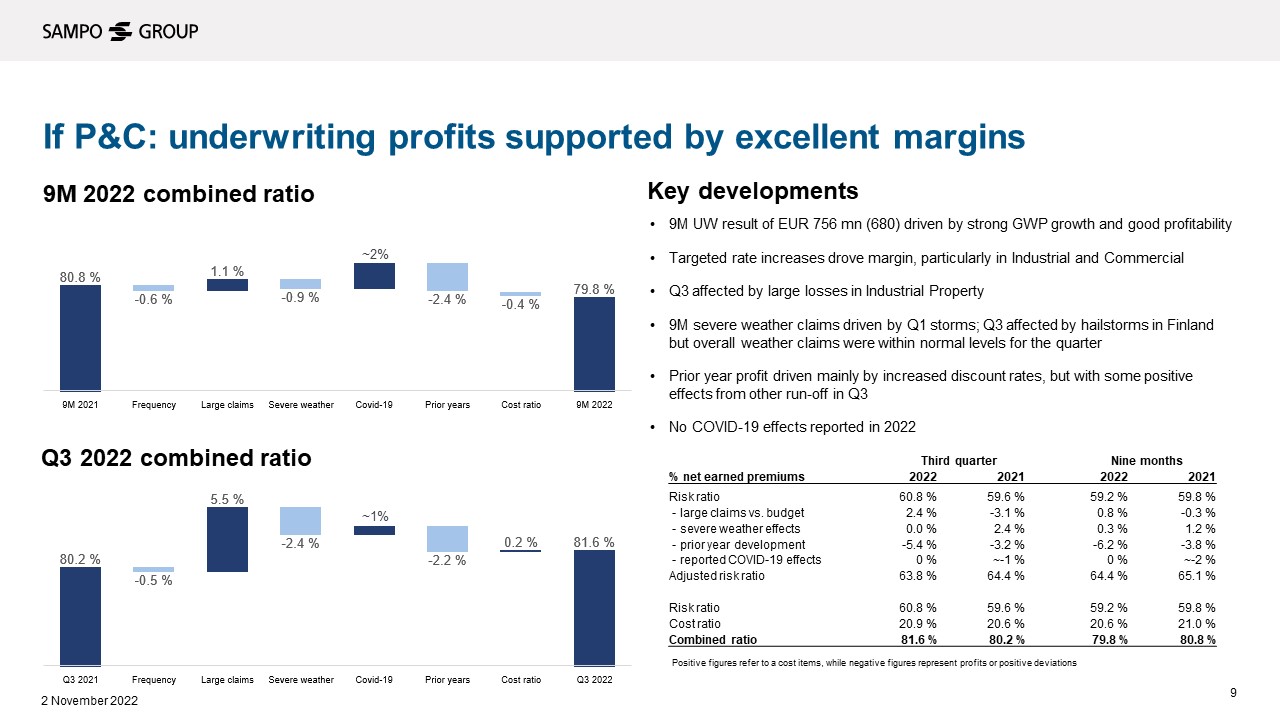
Sampo Group’s core business, P&C insurance reported an underwriting profit of EUR 1,009 million (958) in January-September and EUR 330 million (327) in the third quarter. The Group combined ratio was 81.6 per cent (80.9) in January-September and 82.4 per cent (81.1) in the third quarter.
| Key figures, EURm | 1-9/ 2022 |
1-9/ 2021 |
Change, % |
7-9/ 2022 |
7-9/ 2021 |
Change, % |
|---|---|---|---|---|---|---|
| Profit before taxes | 1,472 | 1,974 | -25 | 407 | 632 | -36 |
| If | 932 | 818 | 14 | 270 | 252 | 7 |
| Topdanmark | 92 | 256 | -64 | 32 | 48 | -33 |
| Hastings | 65 | 115 | -43 | 40 | 31 | 30 |
| Mandatum | 189 | 201 | -6 | 74 | 59 | 24 |
| Holding | 194 | 584 | -67 | -10 | 242 | - |
| Profit for the period | 1,218 | 1,662 | -27 | 321 | 550 | -42 |
| Underwriting profit | 1,009 | 985 | 3 | 330 | 327 | 1 |
| Key figures | 1-9/ 2022 |
1-9/ 2021 |
Change | 7-9/ 2022 |
7-9/ 2021 |
Change |
| Earnings per share, EUR | 2.19 | 2.74 | -0.55 | 0.58 | 0.93 | -0.35 |
| EPS (without eo. items), EUR *) | 2.00 | 2.31 | -0.31 | 0.58 | 0.67 | -0.09 |
| EPS (including OCI), EUR **) | -0.97 | 3.67 | -4.64 | -0.28 | 1.01 | -1.63 |
| RoE (including OCI), % | -6.3 | 22.7 | -29.0 | - | - | - |
*) Nordea-related accounting effects of EUR 103 million in January-September 2022 have been defined as extraordinary items in accordance with Sampo Group’s dividend policy.
The comparison figures included extraordinary items of EUR 237 million in January-September and EUR 144 million in the third quarter.
**) OCI refers to Other comprehensive income.
The figures in this report have not been audited.
What where the key factors behind the solid underwriting performance in Q3?
The Group underwriting profit continued to be supported by strong development in the Nordics, driven by strong premium growth and stable and high retention, leading to an increase of 1 per cent year-on-year. Excluding the reported COVID-19 effects in the comparison period, underwriting profit increased by 5 per cent, in line with our financial targets.
If achieved a stable underwriting profit despite being negatively affected by an unusually high large claims load. Meanwhile Topdanmark increased its underwriting profit by 21 per cent year-on-year in Q3.
In the UK, the motor insurance market has remained challenging which limits Hastings’ growth opportunities in the short-term. Given the current market conditions and the unwind of COVID-19 effects, Hastings’ underwriting profit was solid, although 12 per cent lower than a year ago.
For the first nine months of 2022, Sampo Group’s underwriting profit increased by 3 per cent or 13 per cent excluding the reported COVID-19 effects in the comparison period, well ahead of our financial targets.
What where the key drivers behind If’s currency adjusted GWP growth of 5.7 per cent in Q3?
If’s premium growth was robust across the board and driven primarily by rate increases, continued high and stable retention and an increase in customer count. The strongest growth figures were reported in Business Areas Commercial (11.8%) and Baltic (21.0%).
If’s largest Business Area, Private saw 3.5 per cent premium growth, supported by a rebound in travel insurance volumes and healthy growth in property and personal insurances. However, the growth continued to be negatively affected by weak new car sales in the Nordic, particularly in Sweden which is the largest market area for If. Excluding the Swedish mobility business, the GWP growth during Q3 stood at 4.8 per cent for If Private and 6.8 per cent for If as a whole.
How did the claims inflation develop in Sampo’s core markets?
In the Nordics, claims inflation was at 4-5 per cent during Q3, broadly unchanged from Q2. If continued to increase prices to cover the claims inflation with somewhat above 5 per cent increases in Q3.
In the UK motor insurance market, claims inflation ticked up to 12 per cent in Q3 from 10-12 per cent in Q2 and market prices continued to lag behind. Hastings has remained disciplined in pricing and continued to apply rate increases, supporting currency adjusted GWP growth of 20 per cent in Q3.
If’s combined ratio improved in January-September but deteriorated by 1.4 percentage points to 81.6 per cent in Q3. What explains this development?
The main negative effect in Q3 came from large losses which, as measured by a share of net premiums earned, were 2.4 percentage points above the budged, whereas in the comparison period in 2021, large claims were 3.1 per cent below the budget. The increased number of large claims seen in If’s Industrial business were mostly property fire claims. In addition, in the comparison period, the combined ratio still benefitted by approximately 1 percentage point from COVID-19 effects. On the positive side, the combined ratio benefitted from higher discount rates and lower effects from severe weather.
If’s adjusted risk ratio, which excludes the impact of impact of large losses, severe weather, reported COVID-19 effects and prior year development, improved by 0.5 percentage points in Q3. This translates into an improved adjusted combined ratio in Q3.
Picture from Investor Presentation
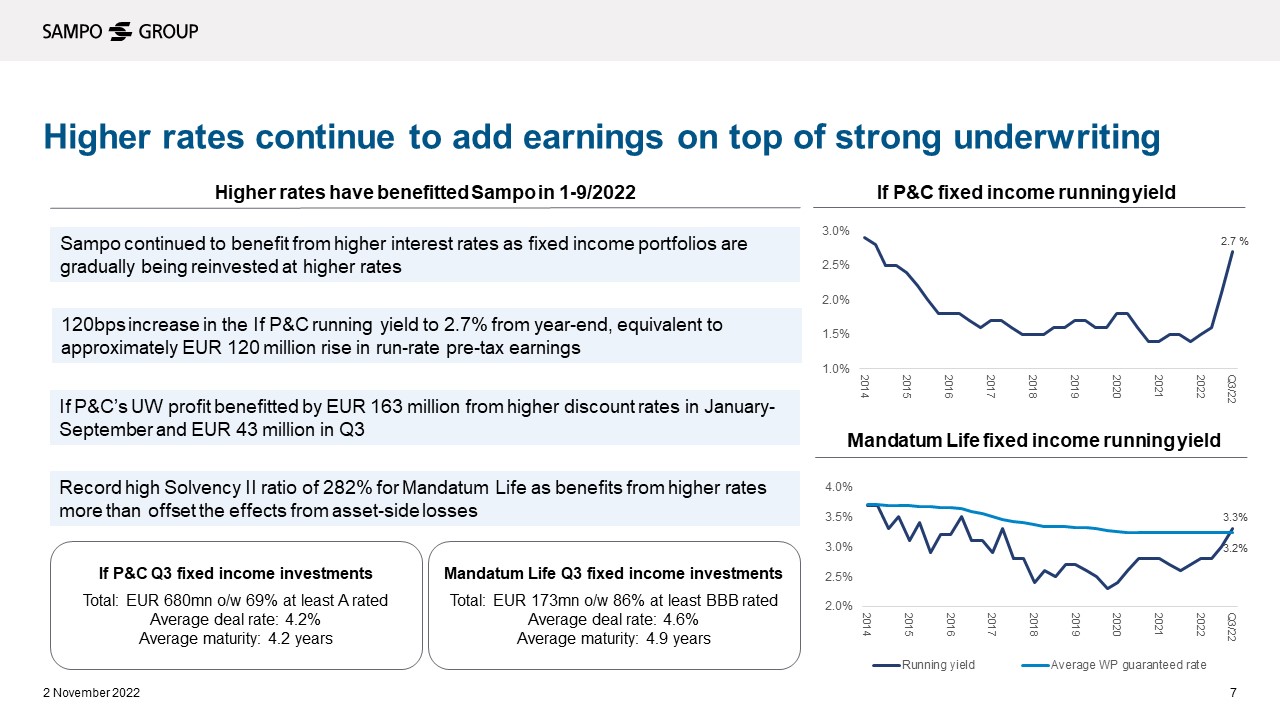
Interest rates continued to rise during the third quarter. How did this affect Sampo?
Sampo has been well positioned to benefit from higher interest rates. The short duration in our fixed income portfolios has enabled the fast rotation into higher yielding instruments, which has reflected to relatively rapid increase in running yields.
In Q3, If’s running yield increased by another 60 basis points to 2.7 per cent, now up 120 basis points from the 1.5 per cent at the 2021 year-end. This translates to approximately EUR 120 million rise in run-rate pre-tax earnings. In addition, If’s underwriting profit benefitted by EUR 43 million from higher discount rates in Q3 and in total EUR 163 in January-September.
Mandatum Life’s running yield increased to 3.3 per cent from 3.0 per at the end of Q2, exceeding the average guaranteed rate of the with-profit portfolio. Higher interest rates also continued to support Mandatum Life’s Solvency II ratio, which increased to a new record of 282 per cent at the end of Q3.
The extremely fast increase in interest rates seen in the UK drove Hastings’ running yield to 5.4 per cent at the end of Q3, up by 240 basis points just during one quarter.
Picture from Investor Presentation
The capital markets were very volatile during Q3 amid increased economic uncertainty. How did this affect Mandatum?
Mandatum reported a solid performance during Q3, supported by a strong operational result (expense result and result from asset management) of EUR 17 million (12). However, as most of Mandatum’s total profit comes from investments, there is no escape from market turbulence affecting investment returns.
Mandatum’s investment result taken through the P&L was stable at EUR 41 million (40) in Q3, but the fair value investment result decreased to EUR -126 million (14), affected by decreasing market values across a broad range of asset classes.
Despite the challenging market environment, net flows into capital light third-party assets remained positive during Q3, highlighting Mandatum’s strong position in the Finnish market. In addition, rising interest rates improve Mandatum’s running yield and support solvency as mentioned above.
Sampo’s balance sheet remained strong in Q3 as both the solvency and leverage ratios improved during the quarter. What were the drivers behind the improvement?
On the solvency side, the Solvency II ratio increased to 256 per cent from 245 per cent at the end Q2. Including the dividend accrual based on the insurance dividend of EUR 1.70 per share for 2021, the Solvency II ratio increased to 238 per cent from 233 percent. The Solvency II ratio is well above the target range of 170-190 per cent.
The main driver behind the improvement was the continued strong operating performance, increasing the Solvency II ratio by 8 percentage points. Capital market effects had a positive effect of 3 percentage points as the benefits of rising interest rates and a lover symmetric adjustment were partially offset by wider credit spreads and currency movements.
Meanwhile Sampo’s financial leverage improved to 25.9 per cent from 29.2 per cent at the end of Q2, clearly within the target of below 30 per cent. The improvement was driven by EUR 0.8 billion reduction in gross debt, consisting of EUR 501 million repurchase of Sampo plc’s senior bonds and the redemption of Hastings’ GBP 250 million (approx. EUR 290 million) senior bond in September.
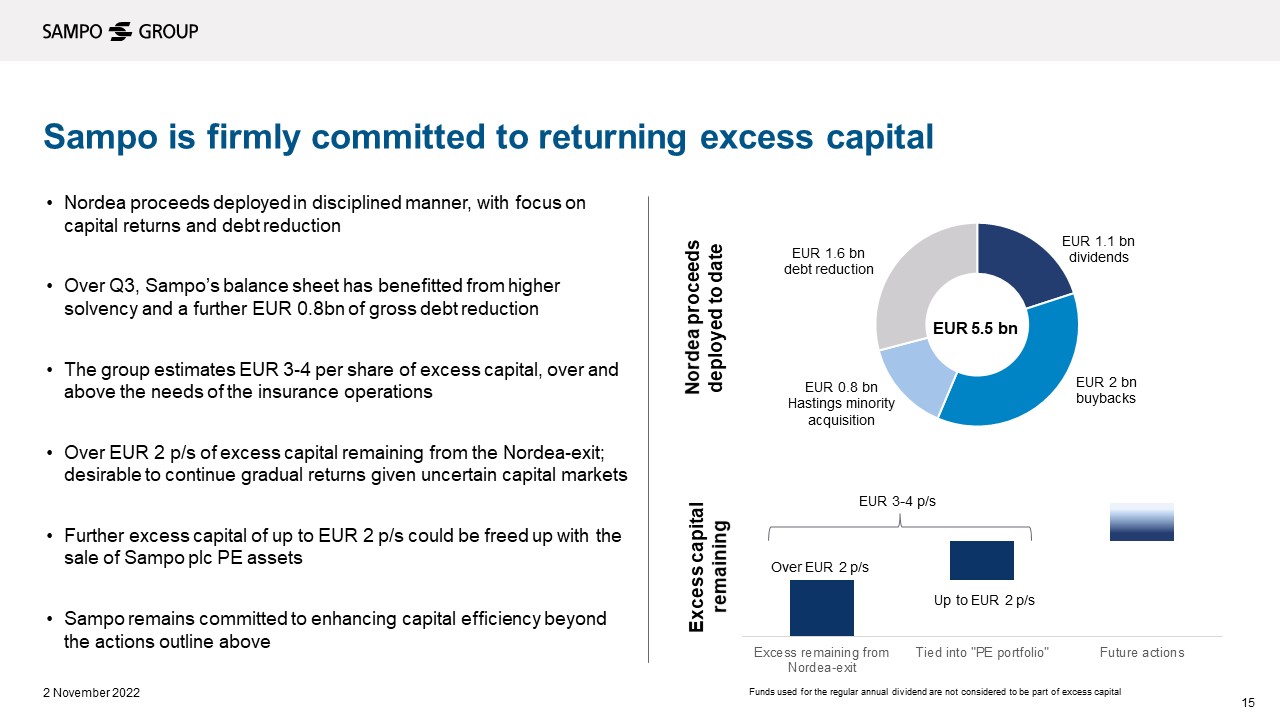
How much excess capital does Sampo hold and when can shareholders expect that to be returned?
The excess capital above the needs of Sampo’s insurance operations is estimated to be EUR 3-4 per share. Of this, over EUR 2 per share is excess capital remaining from the Nordea-exit, which Sampo continues to gradually return to shareholders, given the uncertain capital markets. As communicated, Sampo will announce the Board’s proposal for further capital returns in connection with full-year 2022 results on 10 February 2023.
The rest of the estimated excess capital of EUR 3-4 per share is tied into the so called “PE portfolio” and could be freed up when Sampo eventually exits these investments.
Picture from Investor Presentation
